January 2019 Data Update 9: The Pricing Game
In my last eight posts, I looked at aspects of corporate behavior from investments to financing to dividend policy, using the data that I collected at the start of 2019, to examine what companies share in common, and what makes them different. In summary, I found that the rise in risk premiums in both equity and bond markets in 2018 have pushed up costs of equity and capital, that companies across the globe are finding it difficult to generate returns on their investments that exceed their costs of funding, and that many of them, especially in mature businesses, are returning more cash, much of it in the form of buybacks. Since all of the companies in my data set are publicly traded, there is one final number that I have not addressed directly in my posts so far, and that is the market pricing of these companies. In this post, I complete my data update series, by looking at how pricing varies across companies, sectors and geographies, and what lessons investors can draw from the data.
Value versus Price: The Difference
I have posted many times on the between the value of an asset and its' pricing, but I don't think it hurts to revisit that difference. The determinants of value are simple, although not always easy to estimate. Whether you are valuing start-up businesses, emerging market firms, or commodity companies, the values are driven by expected cash flows, growth, and risk. Although a discounted cash flow valuation is often the tool that we used to give form to these fundamentals, in the form of cash flows, growth rates in these cash flows, and discount rates, it is not the only pathway to intrinsic value. The determinants of price are demand and supply, and while fundamentals do affect both, mood and momentum are also strong forces in pricing. These “animal spirits,” as behavioral economists might tag them, can not only cause price to diverge from value, but also require different tools to be used to assess the right pricing for an asset. With many assets and businesses, pricing an asset usually involves standardizing a price (a multiple), finding similar or comparable assets that are already priced in the marketplace, and controlling for differences. The picture below, which I have used many times before, captures the two processes:
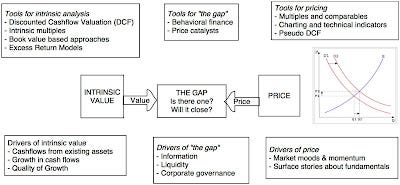
The reason that I reuse this picture so much is because, to me, it is an all-encompassing snapshot of every conceivable investment philosophy that exists in the market:
Efficient Marketers: If you believe that markets are efficient, the two processes will generate the same number, and any gap that exists will be purely random and quickly closed.
Investors: If you are an investor, whether value or growth, and you truly mean it, your view is that the pricing process, for one reason or the other, can deliver a price different from your estimate of value and that the gap that exists will close, as the price converges to value. The difference between value and growth investors lies in where you think markets are most likely to make mistakes (in valuing existing assets or growth opportunities) and correct them. In essence, you are as much a believer in efficient markets as the first group, with the only difference being that you believe markets become efficient after you have taken your position on a stock.
Traders: If you are a trader, you start off with either the presumption that there is no such thing as intrinsic value, or that it exists, but that no one can estimate it. You play the pricing game, effectively using your skills at gauging momentum and forecasting the effects of corporate news on prices, to buy at a low price and sell at a high price.
Market participants are most exposed to danger when they are delusional about the game that they are playing. Many portfolio managers, for instance, claim to be investors, playing the value game, while using pricing screens (PE and growth, PBV and ROE) and adding to their holdings of momentum stocks. Many traders seem to think that they will be viewed as deeper and more accomplished if they talk the value talk, while using charts and technical indicators in the closet, to make their stock picks.
The Pricing Process
The essence of pricing is attaching a number to an asset or company, based upon how similar assets and companies are being priced in the market. To get insight into how to price an asset, a business or a company, you should break down the pricing process into steps:
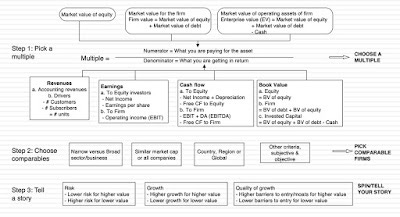
You may be a little puzzled by the first step in the process, where I standardize the price, but the reason is simple. You cannot compare price per share across companies, since it is a function of the share count, which can be changed overnight in a stock split. To standardize prices, you scale them to some variable that all of the assets in the peer group share. With real estate properties, you divide the price of each property by its square footage to arrive at a price/square foot that can be compared across properties. With businesses, you scale pricing to an operating variable, with earnings being the most obvious choice, but it can be revenues, cash flows or book value. Note that any multiple that you find on a stock or company is embedded in this definition, ranging from PE ratios to EV/EBITDA multiples to revenue multiples, and even beyond, to market price per subscriber or user. The second step in the process, i.e., finding similar assets and companies, should make clear the fact that this is a process that requires subjective judgments and is open to bias, just as is the case in intrinsic valuation. If you are pricing Nvidia, for instance, you determine how narrowly or broadly you define the peer group, and which companies to deem to be "similar". The third step int he process requires controlling for differences across companies. Put simply, if the company that you are pricing has higher growth or lower risk or better returns on its investments on it projects that the companies in the peer group, you have to adjust the pricing to reflect it, either subjectively, as many analysts do, with story telling, or objectively, by bringing in key variables into the estimation process.
Pricing the Markets in January 2019
Rather than taking you through multiple after multiple, and overwhelming with pictures and tables on each one, I will list out what I learned by looking at the pricing of all publicly traded stocks around the world, in early 2019, in a series of pricing propositions.
Pricing Proposition 1: Absolute rules don't belong in a relative world!
Paraphrasing Einstein, everything is relative, if you are pricing companies. Is a PE ratio of five low? Not if half the stocks in the market trade at less than five. Is an EV/EBITDA of forty high? Perhaps in some sectors, but not if you are comparing high growth companies in a highly priced sector. Old time value investing is filled with rules of thumb, and many of these rules are devised around absolute values for PE or PEG ratios or Price to Book, at odds with the very notion of pricing. If you want to make pricing statements about what comprises cheap or expensive, you should be looking at the distribution of the multiple across the market. Thus, to form pricing rules on US stocks at the start of 2019, I looked the distribution of current, forward and trailing PE ratios for US stocks on January 1, 2019:
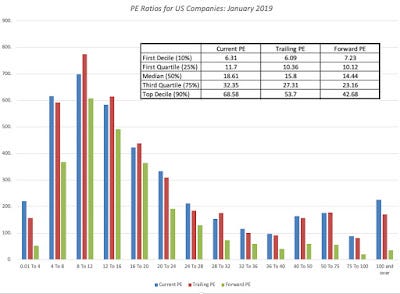
At the start of 2019, a low trailing PE ratio for a US stock would have been 6.09, if you used the lowest decile or 10.36, if you moved to the first quartile, and a high PE ratio, using the same approach, would have been 27.31, with the third quartile, or 53.70, with the top decile. Lest I be accused of picking on value investors, they are not the only or even the biggest culprits, when it comes to absolute rules. Private equity investors and LBO initiators have built their own set of screens. I have lost count of the number of times I have heard it said that an EV to EBITDA less than six (or five or seven) must mean that a company is not just cheap, but a good candidate for leverage, but is that true? To answer the question, I looked at the EV to EBITDA multiples across companies, across regions of the world.
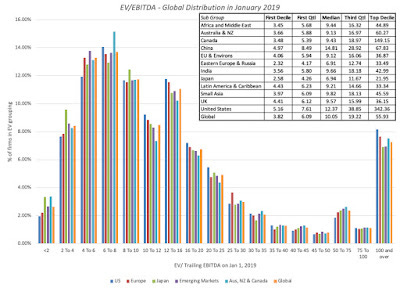
If you wield a pricing bludgeon and declare all companies that trade at less than six times EBITDA to be cheap, you will find about half of all stocks in Russia to be bargains. Even globally, you should hav no trouble finding investments to make with this rule, since almost one quarter of all companies trade at less than six times EBITDA. My point is not that that you cannot have rules of thumb, since they do exist for a reason, but that those rules, in a pricing world, have to be scaled to the data. Thus, if you want to define the first decile as your measure of what comprises cheap, why not make it the first decile? That would mean that an EV to EBITDA multiple less than 5.16 would be cheap in the US on January 1, 2019, but that number would have to recalibrated as the market moves up or down.
Pricing Proposition 2: Markets have a great deal in common, when it comes to pricing, but the differences can be revealing!
Much is made about the differences across global equity markets, and especially about the divide between emerging and developed market companies, when it comes to pricing, with delusions running deep on both sides. Emerging market analysts are convinced that stocks are priced very differently, and often more irrationally, in their local markets, leaving them free to devise their own rules for their markets. Conversely, developed market analysts often bring perspectives about what comprises high, low or average pricing ratios, built up through decades of exposure to US and European markets, to emerging markets and find them puzzling. The data tells a different story, with pricing ratios around the world having distributional characteristics that are surprisingly similar across different parts of the world:
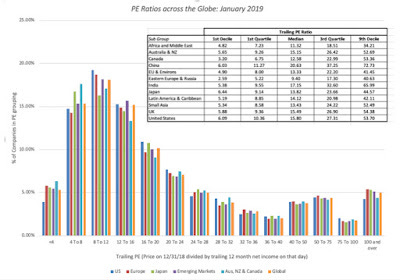
While the levels of PE ratios vary across regions, with Chinese stocks having the highest median PE ratios (20.63) and Russian and East European stocks the lowest (9.40), they all have the same asymmetric look, with a peak to the left (since PE ratios cannot be lower than zero) and a tail to the right (there is no cap on PE ratios). That asymmetry, which is shared by all pricing multiples, is the reason that you should always be cautious about any pricing argument that is built on comparisons to the average PE or PBV, since those numbers will be skewed upwards because of the asymmetry. While it is true that markets share common characteristics, when it comes to pricing, the differences in levels are also worth paying attention to, when investing. A global fund manager who ignores these differences, and picks stocks based upon PE ratios alone, will end up with a portfolio that is dominated by African, Midde East and Russian stocks, not a recipe for investing success.
Pricing Proposition 3: Book value is the most overrated metric in investing
I have never understood the reverence that some investors seem to hold for book value, as revealed in the number of investing adages built around it. Stocks that trade at less than book value are considered cheap, and companies that build up book value are considered to be value creating. At the root of the "book value" focus are two assumptions, sometimes stated but often implicit. The first is that the book value is a measure of liquidation value, an estimate of what investors would get if they shut down the company today and sold its assets. The second is that accountants are consistent and conservative in estimating asset value, unlike markets, which are prone to mood swings. Both assumptions are built on foundations of sand, since book value is not a good measure of liquidation value in most sectors, and accountants are both inconsistent and slow-moving, when it comes to estimating and adjusting book value. Again, to get perspective, let's look at the price to book ratios around the world, at the start of 2019:

If you believe that stocks that trade at less than book value are cheap, you will again find lots of bargains in the Middle East, Africa and Russia, but even in markets like the United States, where less than a quarter of all companies trade at less than book value, they tend to be clustered in industries that are in capital intensive (at least as defined by accountants) and declining businesses.

Note that among the US industries with the fewest stocks that trade at less than book value are a large number of technology and consumer product companies, with utilities and basic chemicals being the only surprises. On the list of US industry groups with the highest percentage of stocks that trade at less than book value are oil companies (at different stages of the business), old time manufacturing companies and life insurance. If you pick your stocks based upon low price to book, in January 2019, your portfolio will be weighted with companies in the latter group, a prospect that should concern you.
Pricing Proposition 4: Most stocks that look cheap deserve to be cheap!
There are traders who have little time for fundamentals, arguing that they have little or no role to play in day to day movements of stock prices. That is probably true, but fundamentals do have significant explanatory power, when it comes to why some companies trade at low multiples of earnings or book value and others are high multiples. To understand the link, I find it most useful to go back to a simple intrinsic value model, and with simple algebraic manipulation, make it a model for a pricing multiple. The picture below shows the paths you would take with an equity multiple (Price to Book) and an enterprise value (EV/Sales) to arrive at their determinants:

Now what? If you buy into the intrinsic view of a price to book ratio, it should be higher for firms that earn high returns on equity, have higher growth and lower risk, and lower for firms that earn low returns on equity, have lower growth and higher risk. Does the market price in fundamentals? For the most part, the answer is yes, as you can see even in the tables that I have provided in this post so far. Russian stocks have the lowest PE ratios, but that reflects the corporate governance concerns and country risk that investors have when investing in them. Chinese stocks in contrast have the highest PE ratios, because even with stepped down growth prospects for the country, they have higher expected growth than most developed market companies. Looking at stocks with the lowest price to book ratios, Middle Eastern stocks have a disproportionate representation because they earn low returns on equity and the industry groupings with the lowest price to book (oil industry groups, steel etc.) also share that feature. Pricing, done right, is therefore a search for mismatches, i.e., companies that look cheap on a pricing multiple without an obvious fundamental that explains it. This table captures some of the mismatches:
MultipleKey DriverValuation MismatchPE ratioExpected growthLow PE stock with high expected growth rate in earnings per sharePBV ratioROELow PBV stock with high ROEEV/EBITDAReinvestment rateLow EV/EBITDA stock with low reinvestment needsEV/capitalReturn on capitalLow EV/capital stock with high return on capitalEV/salesAfter-tax operating marginLow EV/sales ratio with a high after-tax operating margin
Pricing Proposition 5: In pricing, it is not about what "should be" priced in, but "what is" priced in!
In the last proposition, I argued that markets for the most part are sensible, pricing in fundamentals when pricing stocks, but there will be exceptions, and sometimes large ones, where entire sectors are priced on variables that have little to do with fundamentals, at least on the surface. This is especially true if the companies in a sector are early in their life cycles and have little to show in revenues, very little (or even negative) book value and are losing money on every earnings measure. Desperation drives investors to look for other variables to explain prices, resulting in companies being priced based upon website visitors (at the peak of the dot com boom), numbers of users (at the start of the social media craze) and numbers of subscribers.
I noted this phenomenon, when I priced Twitter ahead of its IPO in 2013, and argued that to price Twitter, you should look at its user base (about 240 million at the time) and what markets were paying per user at the time (about $130) to arrive at a pricing of $24 billion, well above my estimate of intrinsic value of $11 billion for the company at a time, but much closer to the actual pricing, right after the IPO. It is therefore neither surprising nor newsworthy that venture capitalists and equity research analysts are more focused on these pricing metrics, when assessing how much to pay for stocks, and companies, knowing this, play along, by emphasizing them in their earnings reports and news releases.
Conclusion
I do believe in intrinsic value, and think of myself more as an investor than a trader, but I am not a valuation snob. I chose the path I did because it works for me and reflects my beliefs, but it would be both arrogant and wrong for me to argue that being a trader and playing the pricing game is somehow less worthy of respect or returns. In fact, the end game for both investors and traders is to make money, and if you can make money by screening stocks using PE ratios or technical indicators, and timing your entry/exit by looking at charts, all the more power to you! If there is a point to this post, it is that a great deal of pricing, as practiced today, is sloppy and ignores, or throws away, data that can be used to make pricing better.
YouTube Video
Data Links
PE ratios by industry grouping: US, Europe, Emerging Markets, Japan, Australia & Canada, India and China
Book Value Multiples by industry grouping: US, Europe, Emerging Markets, Japan, Australia & Canada, India and China
EV to EBIT & EBITDA by industry grouping: US, Europe, Emerging Markets, Japan, Australia & Canada, India and China
EV to Sales by industry grouping: US, Europe, Emerging Markets, Japan, Australia & Canada, India and China
January 2019 Data Updates


