Myth 4.2: It's all about D in the DCF
If you have taken a class on valuation, think back to what you spent most of your time doing and I will wager you spent it talking about discount rates. If there was any attention paid to cash flows and growth, it was either cursory or mechanical, and perhaps as a set up to returning to the discount rate discussion. I blame both practitioners and academia for this focus. The practitioner obsession with discount rates can be seen both in the time spent talking about discount rates at conferences and on estimating it in valuation. Reviewing the academic literature over the last few decades, the preponderance of it has been focused on developing models to estimate expected returns on risky investments (discount rates). As a result, classical portfolio theory and discounted cash flow valuation have become so entangled that, as I noted in my last post, there are those who on losing faith with portfolio theory have also felt the need to abandon DCF valuation as well.
The Discount Rate Obsession
Why are we so focused on discount rates in valuation? One reason is that we attribute more consequence to getting it wrong than we should, partly because of the very first valuation models that we are exposed to. The other is that spending time on the inputs into discount rates gives us a false sense of both control and precision.
The roots of discounted cash flow valuation, at least as practiced today, can be traced back almost 80 years to a treatise by John Williams on value, but its popular usage was tied to the development the Gordon Growth Model, where it was simplified for use with dividends in constant growth.

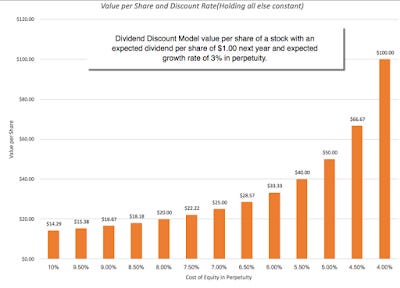
Note that this simplified equation is built on two assumptions: that companies pay out what they can afford to (excess cash) in dividends and that these dividends can grow at a constant rate forever. In this model, it is easy to see why the valuation exercise becomes one of estimating discount rates since the dividends are known and the growth rate is constrained to be less than equal to the economy. In fact, staying with the constant growth model, which is how the terminal value is estimated in more expansive versions of the DCF (with free cash flows replacing dividends and high growth periods as front ends to the terminal value), the effect of changing the discount rate on value can be considerable. To illustrate this, I estimate the value per share for a company that is expected to pay a dividend per share of $1.00 next year, growing 3% a year in perpetuity, for costs of equity (discount rates) ranging from 4% to 10%.

No wonder estimating discount rates paralyzes analysts, since getting it wrong could lead you to value a $16.67 stock (if 10% is the right discount rate) at $100 (if you use 4% as the discount rate).
There is also a behavioral component at play in the discount rate focus. When faced with significant uncertainty in valuation, it is comforting to turn our attention back to discount rates, where we can draw on established models and data to estimate and fine tune the components (risk premiums, betas, costs of debt). Estimating risk free rates, betas and equity risk premiums to the second, third or even fourth decimal points offers the illusion of control in a world where estimates of revenue growth and operating margins are difficult.
The Cross Sectional Distribution of Cost of Capital
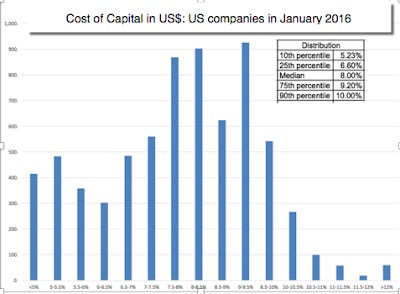
Is the focus on discount rates merited? How important is it to get the discount rate right? To answer that question, it is best to look at the numbers. At the start of 2016, as I have at the start of each of the prior years, I estimated the costs of capital for individual companies in a process that I described more fully in this post. The graph below provides the distribution of costs of capital, in US dollars, for US companies at the start of 2016:

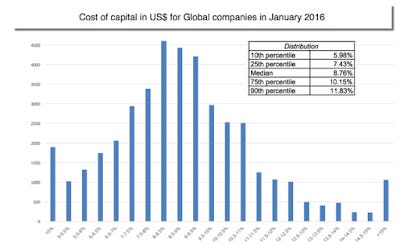
The most striking feature of this graph is the bunching together of costs of capital around 8.5%, with half of all companies having costs of capital between 6.6% and 9.20%. Expanding the sample to look at all 41,889 companies listed globally, you do get a wider distribution, even in US dollar terms, as you get bigger differences in country risk play out in the computation.

Even in this broader sample, the costs of capital, in US $, of most global companies lies in a tight range, with 50% of companies falling between 7.43% and 10.15%. Moving to other currencies will cause the costs of capital to change, not because there is currency risk, but because of differences in inflation. Thus, the range for cost of capital, in Indian rupee terms, allowing for an inflation differential of 5% with the US dollar, would mean that the range in rupee terms will be 12.43% to 15.15% for half of all global companies.
Conclusion
Instead of spending most of our time during valuation estimating discount rates and debating how best to measure risk, as we are prone to do, we will be better served spending more time estimating expected cash flows and growth rates, since big mistakes in valuation are more likely to be made there. While I would make this statement about any company, it is particularly true for younger companies and in the face of uncertainty about the future. In fact, let me propose a compromise. If you have to value a US company in a hurry, why not just use a cost of capital of 8% in July 2016, the median value for US stocks, and spend your limited time on the numerator (cash flows)?
YouTube Video
Attachments
DCF Myth PostsIntroductory Post: DCF Valuations: Academic Exercise, Sales Pitch or Investor Tool
If you have a D(discount rate) and a CF (cash flow), you have a DCF.
It's all about D in the DCF (Myths 4.1, 4.2, 4.3, 4.4 & 4.5)
The Terminal Value: Elephant in the Room! (Myths 5.1, 5.2, 5.3, 5.4 & 5.5)
A DCF requires too many assumptions and can be manipulated to yield any value you want.
A DCF cannot value brand name or other intangibles.
A DCF yields a conservative estimate of value.
If your DCF value changes significantly over time, there is something wrong with your valuation.
A DCF is an academic exercise.


