If you have been reading my posts, you know that I have an obsession with equity risk premiums, which I believe lie at the center of almost every substantive debate in markets and investing. As part of that obsession, since September 2008, I have estimated an equity risk premium for the S&P 500 at the start of each month, and not only used that premium, when valuing companies during that month, but shared my estimate on my webpage and on social media. In my last post, on country risk premiums, I used the equity risk premium of 5.00% that I estimated for the US at the start of July 2023, for the S&P 500. That said, I don't blame you, if are confused not only about how I estimate this premium, but what it measures. In fact, an article in MarketWatch earlier this year referred to the equity risk premium as an esoteric concept, a phrasing that suggested that it had little relevance to the average investor. Adding to the confusion are the proliferation of very different numbers that you may have seen attached to the current equity risk premium, each usually quoting an expert in the field, but providing little context. Just in the last few weeks, I have seen a Wall Street Journal article put the equity risk premium at 1.1%, a Reuters report put it at 2.2%, and a bearish (and widely followed) money manager estimate the equity risk premium to be negative. How, you may ask, can equity risk premiums be that divergent, and does that imply that anything goes? In this post, I will not try to argue that my estimate is better than others, since that would be hubris, but instead focus on explaining why these ERP differences exist, and let you make your own judgment on which one you should use in your investing decisions.
ERP: Definition and Determinants
The place to start this discussion is with an explanation of what an equity risk premium is, the determinants of that number and why it matters for investors. I will try to steer away from models and economic jargon in this section, simply because they do little to advance understanding and much to muddy the waters.
What is it?
Investors are risk averse, at least in the aggregate, and while that risk aversion can wax and wane, they need at least the expectation of a higher return to be induced to invest in riskier investments. In short, the expected return on a risky investment can be constructed as the sum of the returns you can expect on a guaranteed investment, i.e., a riskfree rate, and a risk premium, which will scale up as risk increases.
Expected Return = Risk free Rate + Risk Premium
Note that this proposition holds even if you believe that there is nothing out there that is truly risk free, which is the case when you worry about governments defaulting, though it does imply that you have cleaning up to do to get to a riskfree rate. Note also that expectations do not always pan out, and the actual returns on a risky investment can be much lower than the risk free rate, and sometimes sharply negative.
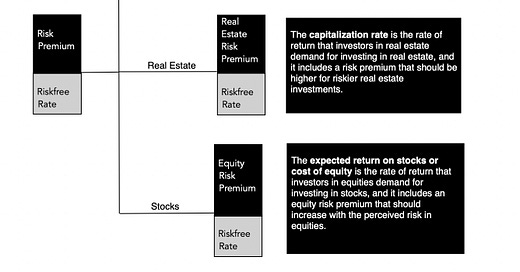
The risk premium that you demand has different names in different markets. In the corporate bond market, it is a default spread, an augmentation to the interest rate that you demand on a bond with more default risk. In the real estate market, it is embedded in a capitalization rate, an expected return used by real estate investors to convert the income on a real estate property into a value for that property. In the equity market, it is the equity risk premium, the price of risk for investing in equities as a class.
As you can see, every asset class has a risk premium, and while those risk premiums are set by investors within each asset class, these premiums tend to move together much of the time.
Determinants
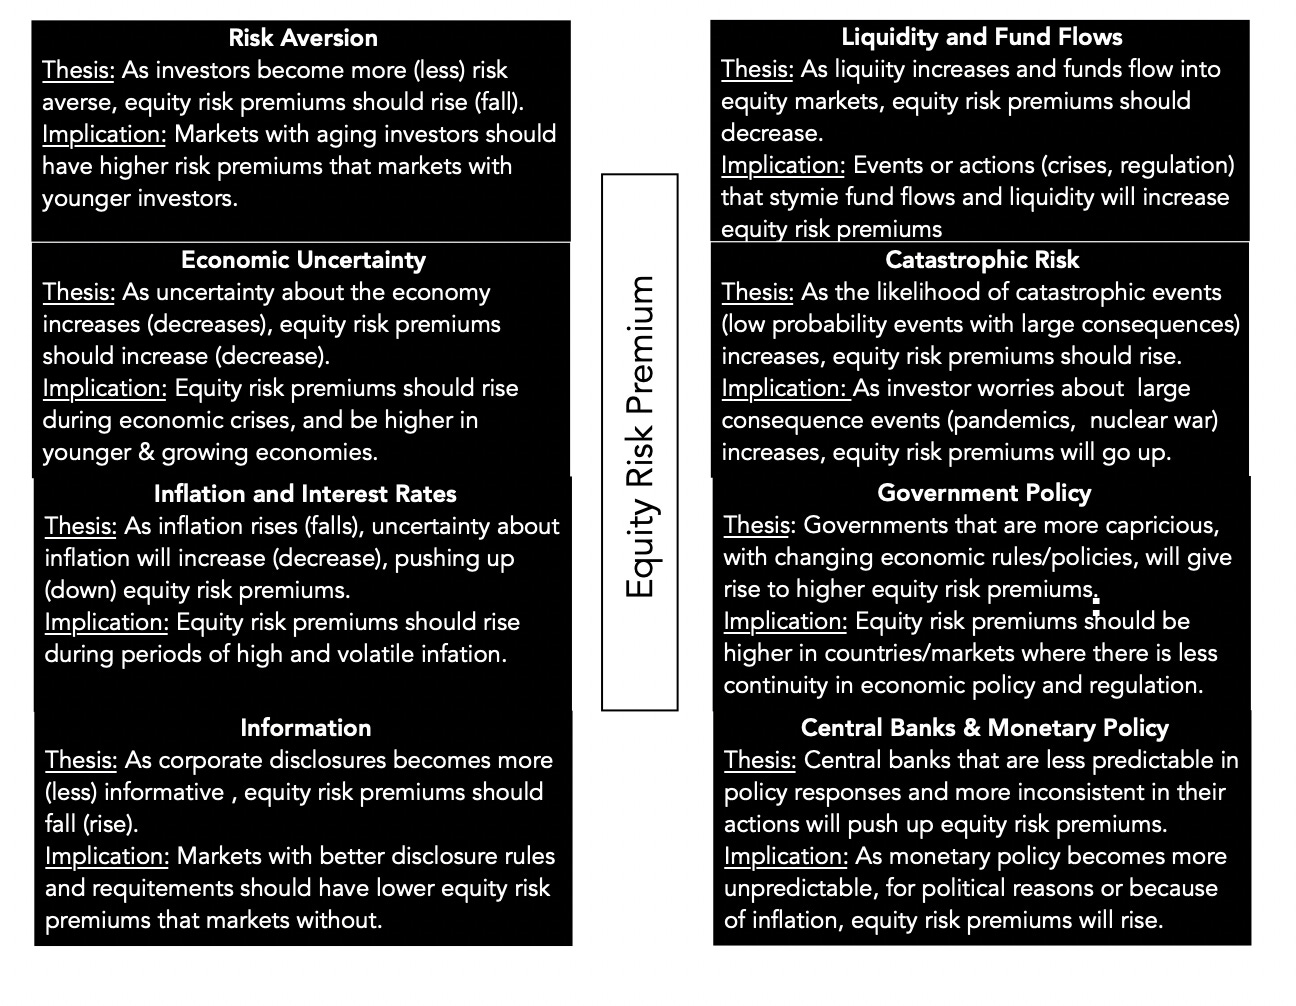
Since the equity risk premium is a price for risk, set by demand and supply, it stands to reason that it is driven not only by economic fundamentals, but also by market mood. Equities represent the residual claim on the businesses in an economy, and it should come as no surprise that the fundamentals that determine it span the spectrum:
Even a cursory examination of these fundamentals should lead you to conclude that not only will equity risk premiums vary across markets, providing an underpinning for the divergence in country risk premiums in my last post, but should also vary across time, since the fundamentals themselves change over time.
Market prices are also driven by mood and momentum, and not surprisingly, equity risk premiums can change, as these moods shift. In particular, equity risk premiums can become too low (too high) if investors are excessively upbeat (depressed) about the future, and thus become the ultimate receptacles for market hope and fear. In fact, one symptom of a market bubble is an equity risk premium that becomes so low that it is disconnected from fundamentals, setting up for an inevitable collision with reality and a market correction.
Why it matters
If you are a trader, an investor or a market-timer, and you are wondering why you should care about this discussion, it is worth recognizing that the equity risk premium is a central component of what you do, even if you have never explicitly estimated or used it.
Market Timing: When you time markets, you are making a judgment on how an entire asset class (equities, bonds, real estate) is priced, and reallocating your money accordingly. In particular, if you believe that stocks are over priced, you will either have less of your portfolio invested in equities or, if you are aggressive, sell short on equities. Any statement about market pricing can be rephrased as a statement about equity risk premiums; if you believe that the equity risk premium, as priced in by the market, has become too low (relative to what you believe is justified, given history and fundamentals), you are arguing that stocks are over priced (and due for a correction). Conversely, if you believe that the equity risk premium has become too high, relative again to what you think is a reasonable value, you are contending that stocks are cheap, in the aggregate.
Stock Picker: When you invest in an individual stock, you are doing so because you believe that stock is trading at a price that is lower than your estimate of its value. However, to make this judgment, you have to assess value in the first place, and while we can debate growth potential and profitability, the equity risk premium becomes an input into the process, determining what you should earn as an expected return on a stock. Put simply, if you are using an equity risk premium in your company valuation that is much lower (higher) than the market-set equity risk premium, you are biasing yourself to find the company to be under (over) valued. A market-neutral valuation of a company, i.e., a valuation of the company given where the market is today, requires you to at least to try to estimate a premium that is close to what the market is pricing into equities.
Corporate Finance: The role of the equity risk premium in determining the expected return on a stock makes it a key input in corporate finance, as well, because that expected return becomes the company's cost of equity. That cost of equity is then embedded in a cost of capital, and as equity risk premiums rise, all companies will see their costs of capital rise. In a post from the start of this year, I noted how the surge in equity risk premiums in 2022, combined with rising treasury bond rates, caused the cost of capital to increase dramatically during the course of the year.
Put simply, the equity risk premiums that we estimate for markets have consequences for investors and businesses, and in the next section, I will look at ways of estimating it.
Measurement
If the equity risk premium is a market-set number for the price of risk in equity markets, how do we go about estimating it? Unlike the bond market, where interest rates on bonds can be used to back out default spreads, equity investors are not explicit about what they are demanding as expected returns when they buy stocks. As a consequence, a range of approaches have been used to estimate the equity risk premium, and in this section, I will look at the pluses and minuses of each approach.
1. Historical Risk Premium
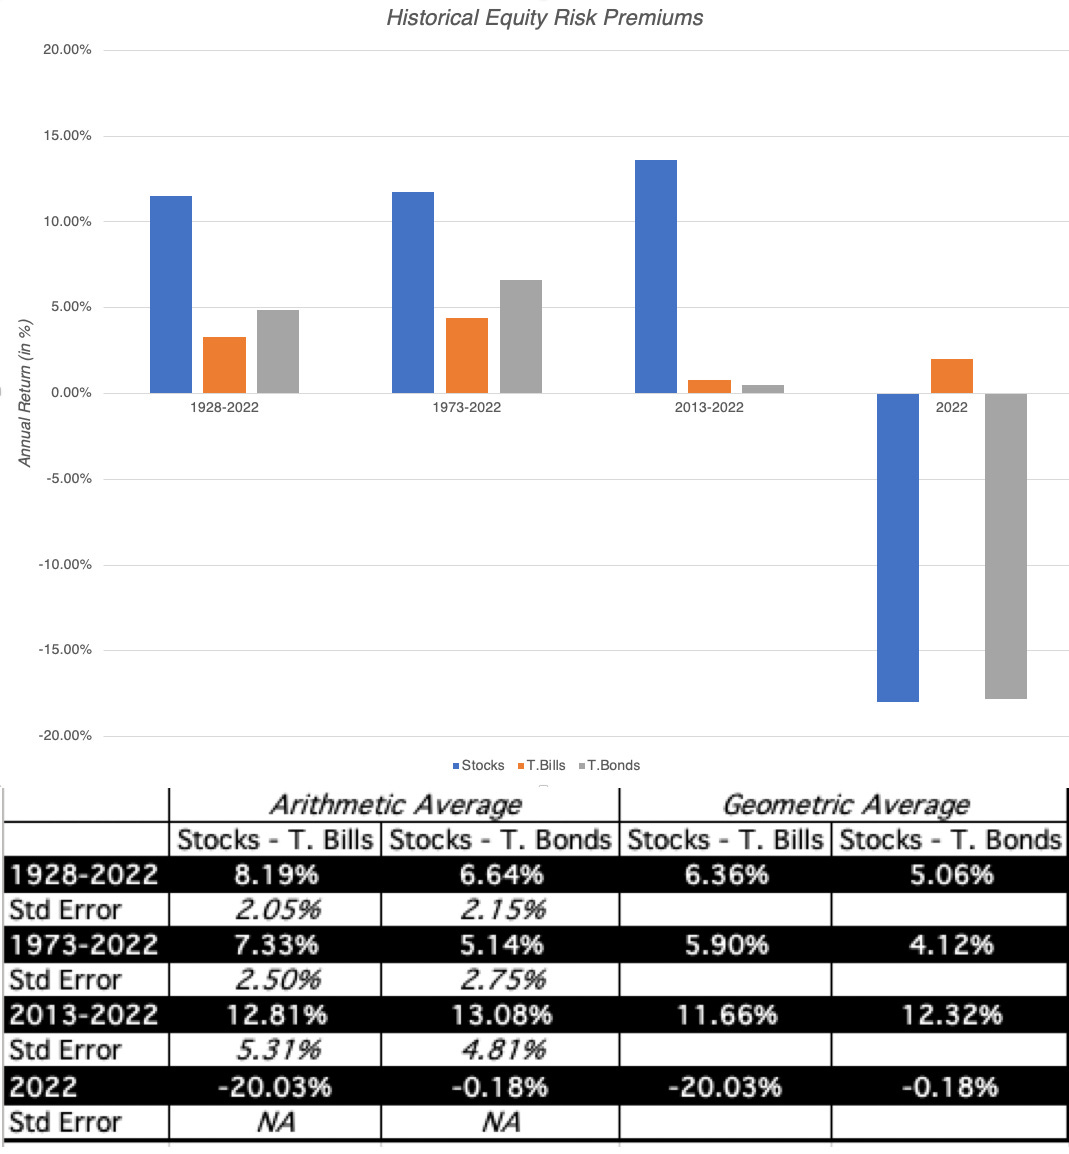
While we cannot explicitly observe what investors are demanding as equity risk premiums, we can observe what they have earned historically, investing in stocks instead of something risk free (or close). In the US, that data is available for long periods, with the most widely used datasets going back to the 1920s, and that data has been sliced and diced to the point of diminishing returns. At the start of every year, I update the data to bring in the most recent year's returns on stocks, treasury bonds and treasury bills, and the start of 2023 included one of the most jarring updates in my memory:
Spreadsheet with historical data
It was an unusual year, not just because stocks were down significantly, but also because the ten-year treasury bond, a much touted safe investment, lost 18% of its value. Relative to treasury bills, stocks delivered a negative risk premium in 2022 (-20%), but it would be nonsensical to extrapolate from a single year of data. In fact, even if you stretch the time periods out to ten, fifty or close to hundred years, you will notice that your estimates of expected returns come with significant error (as can be seen in the standard errors).
In much of valuation, especially in the appraisal community, historical risk premiums remain the prevalent standard for measuring equity risk premiums, and there are a few reasons.
Perhaps, the fact that you can compute averages precisely gets translated into the delusion that these averages are facts, when, in fact, they are not just estimates, but very noisy ones. For instance, even if you use the entire 94-year time period (from 1928-2022), your estimate for the equity risk premium for stocks over ten-year treasury bonds is that it falls somewhere between 2.34% to 10.94%, with 95% confidence (6.64% ± 2* 2.15%).
It is also true that the menu of choices that you have for historical equity risk premiums, from a low of 4.12% to a high of 13.08%, depending on then time period you look at, and what you use as a riskfree rate, gives analysts a chance to let their biases play out. After all, if your job is to come up with a low value, all you have to do is latch on to a high number in this table, claim that it is a historical risk premium and deliver on your promise.
When using historical equity risk premiums, you are assuming mean reversion, i.e., that returns revert to historic norms over time, though, as you can see, those norms can be different, using different time periods. You are also assuming that the economic and market structure has not changed significantly over the estimation period, i.e., that the fundamentals that determine the risk premium have remained stable. For much of the twentieth century, historical equity risk premiums worked well as risk premium predictors in the United States, precisely because these assumptions held up. With China's rise, increased globalization and the crisis of 2008 as precipitating factors, I would argue that the case for using historical risk premiums has become much weaker.
2. Historical Returns-Based Forecasts
The second approach to using historical returns to estimate equity risk premiums starts with the same data as the first approach, but rather than just use the averages to make the estimates, it looks for time series patterns in historical returns that can be used to forecast expected returns. Put simply, this approach brings into the estimate the correlation across time in returns:
If the correlations across time in stock returns were zero, this approach would yield results similar to just using the averages (historical risk premiums), but it they are not, it will lead to different predictions. Looking at historical returns, the correlations start off close to zero for one-year returns but they do become slightly more negative as you lengthen your time periods; the correlation in returns over 5-year time periods is -0.15, but it is not statistically significant. However, with 10-year time horizon, even that mild correlation disappears. In short, while it may be possible to coax a predictive model using only historical stock returns, that model is unlikely to yield much in actionable predictions. There are sub-periods where the correlation is higher, but I remain skeptical of any ERP prediction model built around just the time series of stock returns.
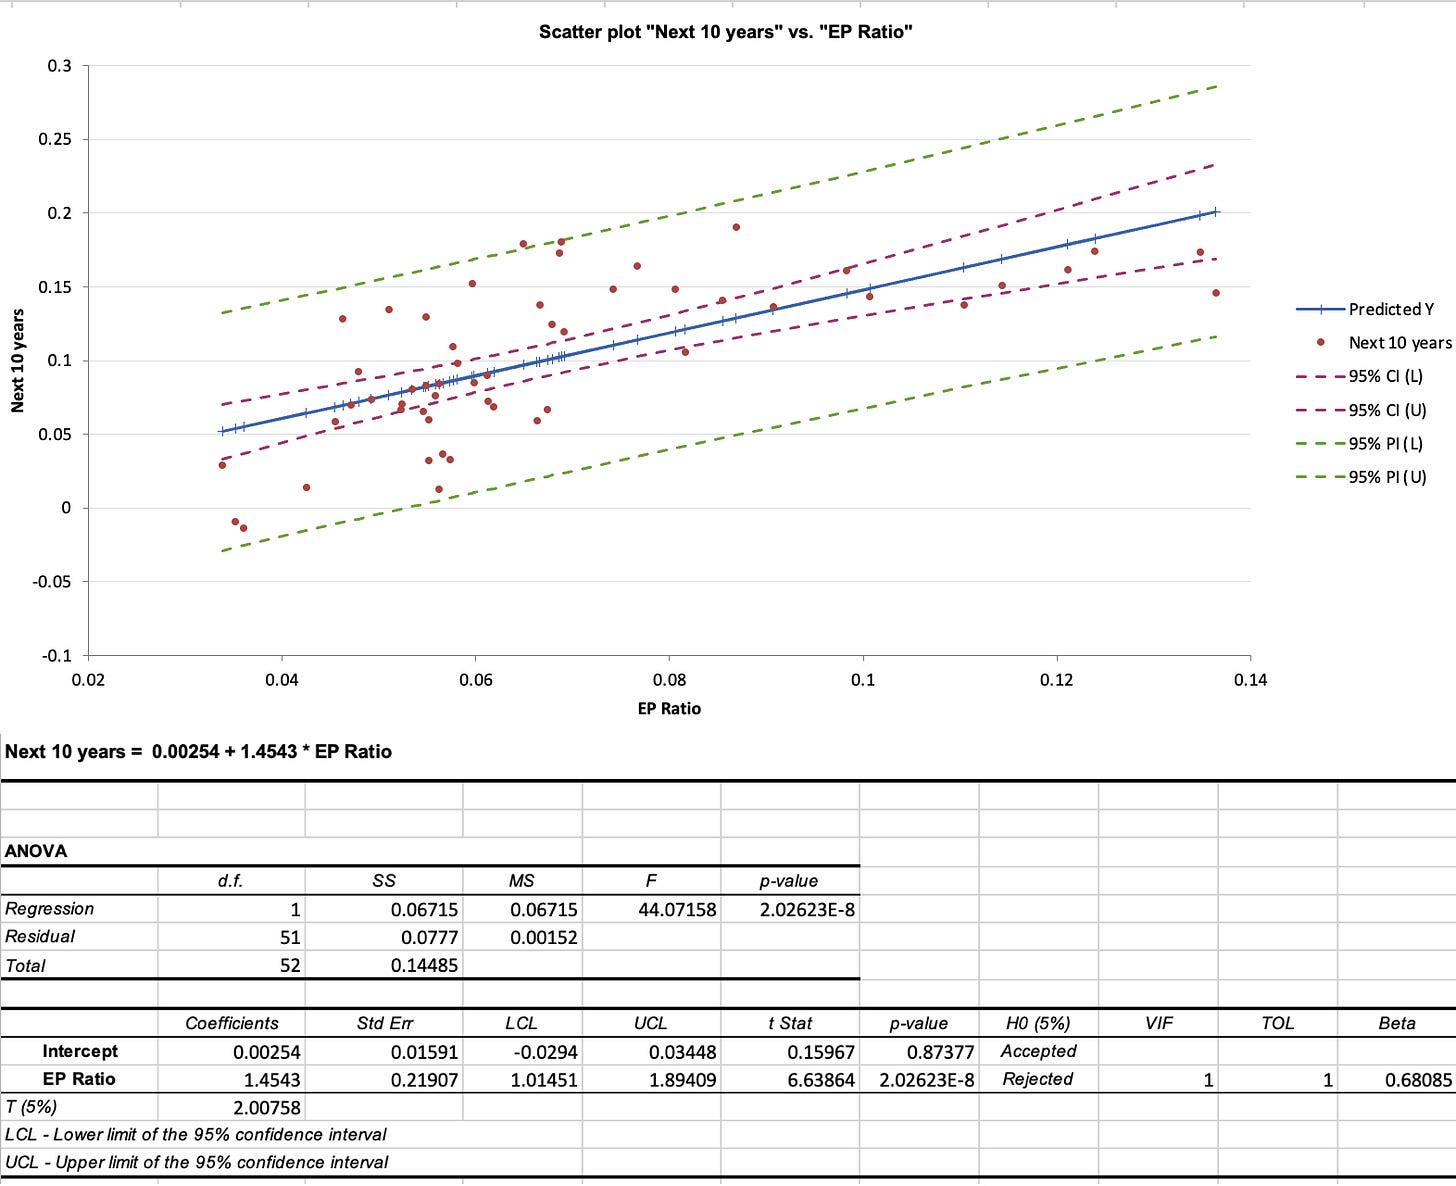
In an extension of this approach, you could bring in a measure of the cheapness of stocks (PE ratios or earnings yields are the most common ones) into the historical return data and exploit the relationship (if any) between the two. If there is a relationship, positive or negative, between PE ratios and subsequent returns, a regression of returns against PE (or EP) ratios can be used to generate predictions of expected annual returns in the next year, next 5 years or the next decade. The figure below is the scatter plot of earnings to price ratios against stock returns in the subsequent ten years, using data from 1960 to 2022
:
A regression using this data yields some of the lowest estimates of the ERP, especially for longer time horizons, because of the elevated levels of PE ratios today. In fact, at the current EP ratio of about 4%, and using the historical statistical link with long-term returns, the estimated expected annual return on stocks, over the next 10 years and based on this regression is:
Expected Return on Stocks, conditional on EP = .00254 + 1.4543 (.04) = .0607 or 6.07%
ERP based on EP-based Expected Return = 6.07% - 3.97% = 2.10%
It is worth remembering that the expected return predictions come with error, and the more appropriate use of this regression is to get a range for the expected annual return, which yields predictions ranging from 4% to 8%. Extending the regression back to 1928 increases the R-squared and results in some regressions that yield predicted stock returns that are lower than the treasury-bond rate, i.e., a negative equity risk premium, given the EP ratio today.
Note that the results from this regression just reinforce rules of thumb for market timing, based upon PE ratios, where investors are directed to sell (buy) stocks if PE ratios move above (below) a “fair value” band. Since those rules of thumb have yielded questionable results, it pays to be skeptical about these regressions as well, and there are three limitations that those who use it have to keep in mind.
First, with the longer time-period predictions, where the predictive power is strongest, the same data is counted multiple times in the regression. Thus, with 5-year returns, you match the EP ratio at the end of 1960 with returns from 1961 to 1965, and then the EP ratio at the end of 1961 with returns from 1962 to 1966, and so on. While this does not imply that you cannot run these regression, it does indicate that the statistical significance (R squared and t statistics) are overstated for the longer time horizons. In addition, the longer your time horizon, the more data you lose. With a 10-year time horizon, for instance, the last year that you can use for predictions is 2012, with the EP ratio in that year matched up to the returns from 2013-2022.
Second, as is the case with the first approach (historical risk premiums), you are assuming that the structural model is stable and that there will be mean reversion. In fact, within this time period (1928 - 2022), the predictive power is far greater between 1928 and 1960 than it is betweeen 196 and 2022.
Third, while these models tout high R-squared, the number that matters is the standard error of the predictions. Predicting that your annual return will be 6.07% for the next decade with a standard error of 2% yields a range that leaves you, as an investor, in suspended animation, since you face daunting questions about follow through: Does a low expected return on stocks over the next decade mean that you should pull all of your money out of equities? If yes, where should you invest that cash? And when would you get back into equities again?
Proponents of this approach are among the most bearish investors in the market today, but it is worth noting that this approach would have yielded “low return” predictions and kept you out of stocks for much of the last decade.
3. The Fed Model: Earnings Yield and ERP
The problem with historical returns approaches is that they are backward-looking, when equity risk premiums should be about what investors expect to earn in the future. To the extent that value is driven by expected future cash flows, you can back out an equity risk premium from current stock prices, if you are willing to make assumptions about earnings growth and cash flows in the future. In the simplest version of this approach, you start with a stable-growth dividend discount model, where the value of equity can be written as the present value of dividends, growing at a constant rate forever:
If you assume that earnings will stagnate at current levels, i.e., no earnings growth, and that companies pay out their entire earnings as dividends (payout ratio = 100%), the cost of equity can be approximated by the earnings to price ratio:
Alternatively, you can assume that there is earnings growth and that companies earn returns on equity equal to their costs of equity, you arrive at the same result:
In short, the earnings to price ratio becomes a rough proxy for what you can expect to earn as a return on stocks, if you are willing to assume no earnings growth or that firms generate no excess returns.
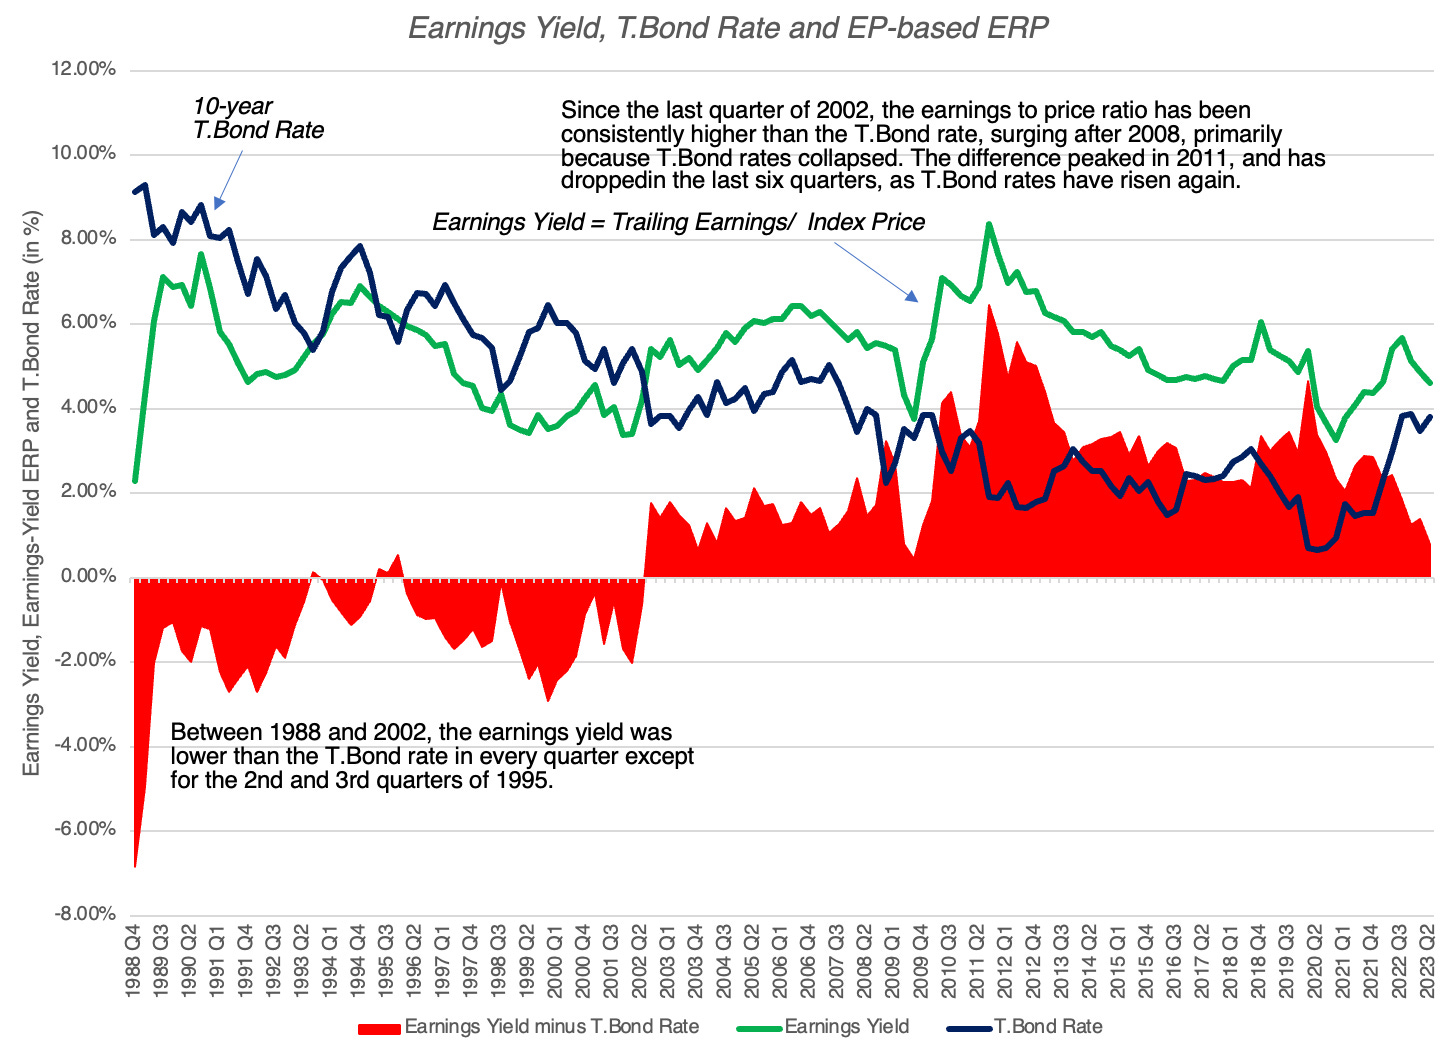
This is the basis for the widely used Fed model, where the earnings yield is compared to the treasury bond rate, and the equity risk premium is the difference between the two. In the figure below, you can see the equity risk premiums over time that emerge from this comparison, on a quarterly basis, from 1988 to 2023:
As you can see, this approach yields some "strange" numbers, with negative equity risk premiums for much of the 1990s, one of the best decades for investing in stocks over the last century. It is true that the equity risk premiums have been much more positive in this century, but that is largely because the treasury bond rate dropped to historic lows, after 2008. As interest rates have risen over the last year and a half, with stock prices surging over the same period, the equity risk premium based on this approach has dropped, standing at 0.41% at the start of August 2023. Since this is the approach used in the Wall Street Journal article, it explains the ERP being at a two-decade low, but I do find it odd that there is no mention that this approach yielded negative premiums in the 1980s and 1990s. In a variant, the Wall Street Journal article also looks at the difference between the earnings yield and the inflation-protected treasury rate, which yields a higher value for the ERP, of about 3%, but suffers from many of the same issues as the standard approach.
My problem with the earnings yield approach to estimating equity risk premiums is that the assumptions that you need to make to justify its use are are at war with the data. First, while earnings growth for US stocks has been negative in some years, it has been positive every decade for the last century, and there are no analysts (that I am aware of) expecting it be zero (in nominal terms) in the future. Second, assuming that the return on equity is equal to the cost of equity may be easy on paper, but the actual return on equity for companies in the S&P 500 was 19.73% in 2022, 17.04% over the last decade and has been higher than the cost of equity even in the worst year in this century (9.35% in 2008). If you allow for growth in earnings and excess returns, it is clear that earnings yield will yield too low a value for the ERP, because of these omissions, and will yield negative values in many periods, making it useless as an ERP estimator for valuation.
4. Implied ERP
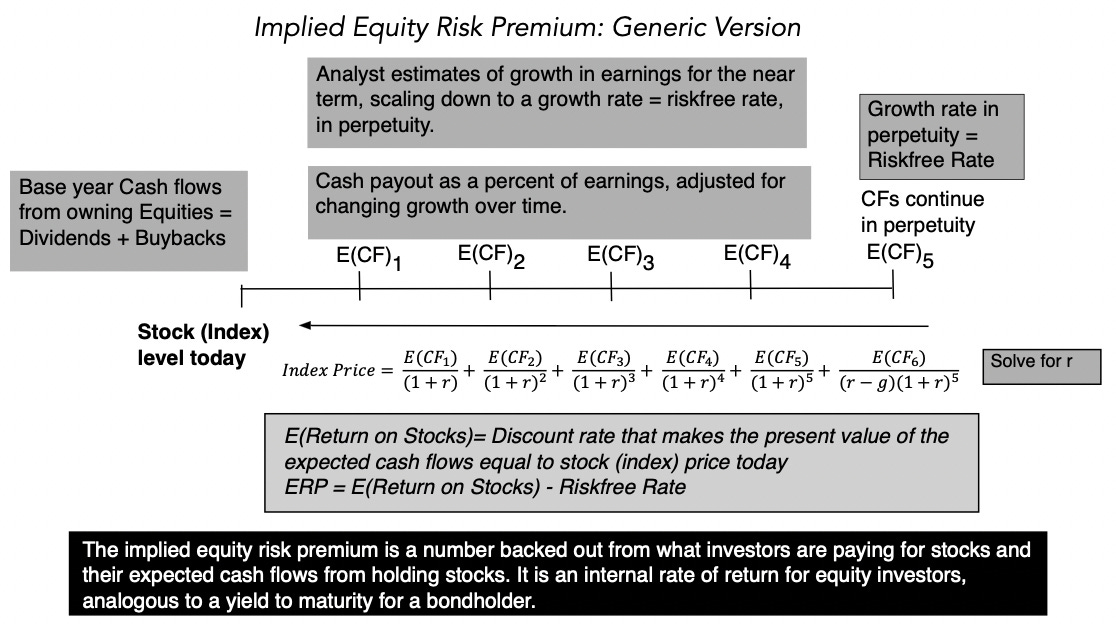
I start with the same general model for value that the earnings yield approach does, which is the dividend discount model but change three components
Augmented Dividends: It is undeniable that companies around the world, but especially in the US, have shifted from returning cash in the form of dividends to stock buybacks. Since two-thirds of the cash returned in 2022 was in the form of buybacks, ignoring them will lead to understating expected returns and equity risk premiums. Consequently, I add buybacks to dividends to arrive at an augmented measure of cash returned and use that as the base for my forecasts.
Allow for near-term growth in Earnings: Since the objective is to estimate what investors are demanding as an expected return, given their expectations of growth, I use analyst estimates of growth in earnings for the index. To get these growth rates, I focus on analysts who estimate aggregated earnings growth the index, rather than aggregating the growth rates estimated by analysts for individual companies, where you risk double counting buybacks (since analyst estimates are often in earnings per share) and bias (since company analysts tend to over estimated growth).
Excess Returns and Cashflows: I start my forecasts by assuming that companies will return the same percentage of earnings in cash flows, was they did in the most recent year, but I allow for the option of adjusting that cash return percentage over time, as a function of growth and return on equity (Sustainable cash payout = Growth rate/ Return on Equity).
The resulting model in its generic form is below:
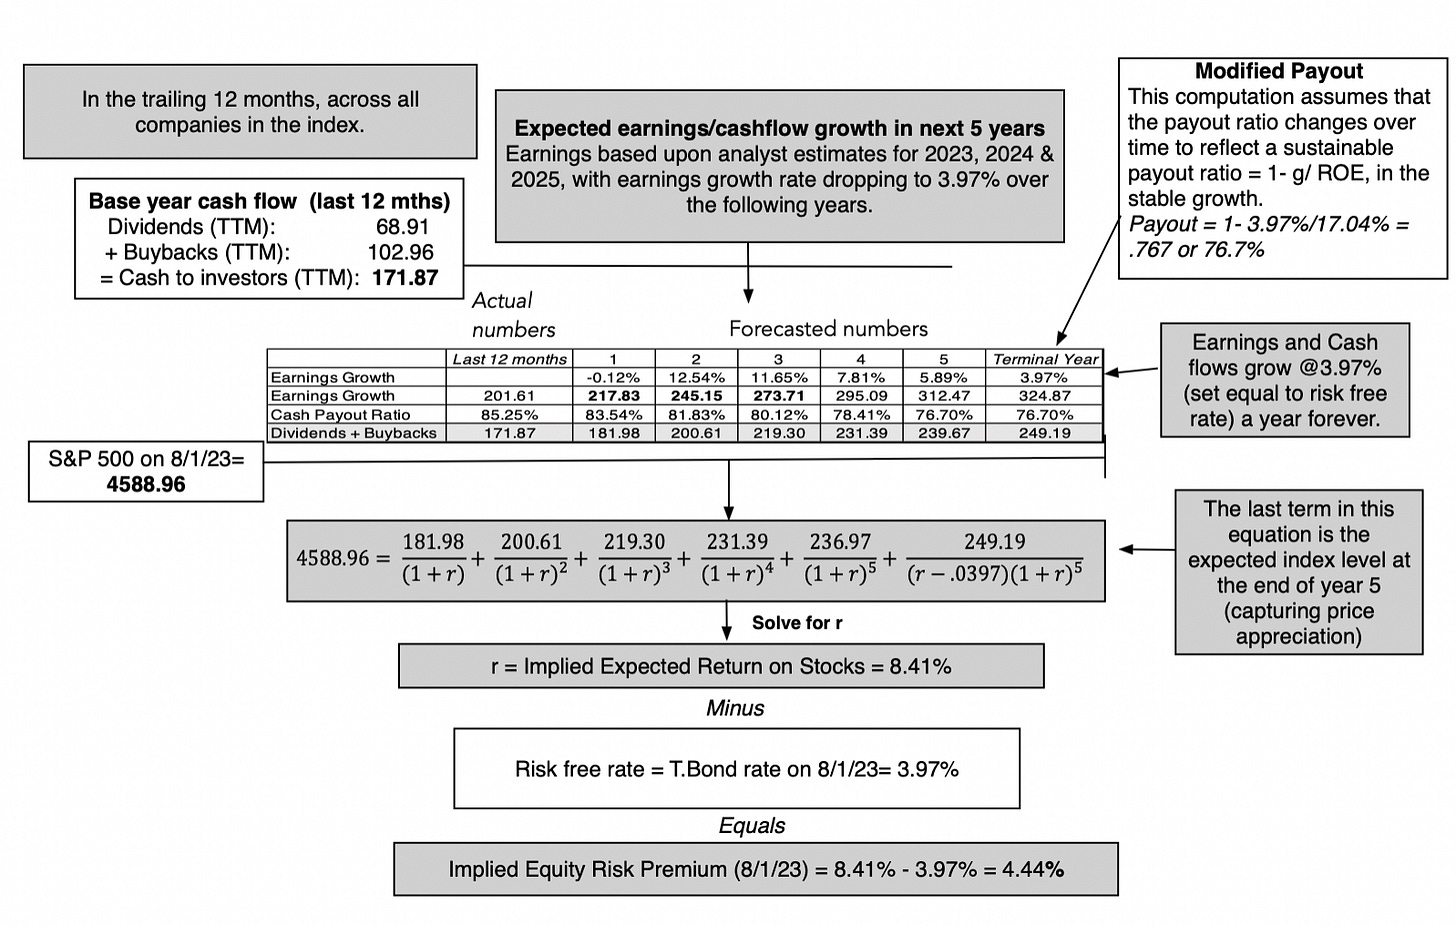
In August 2023, this model would have yielded an equity risk premium of 4.44% for the S&P 500, using trailing cash flows from the last twelve months as a starting point, estimating aggregate earnings for the companies from analyst estimates, for the next three years, and then scaling that growth down to the risk free rate, as a proxy for nominal growth in the economy, after year 5:
Download implied ERP spreadsheet
To reconcile my estimate of the equity risk premium with the earnings yield approach, you can set the earnings growth rate to zero and the cash payout to 100%, in this model, and you will find that the equity risk premium you get converges on the 0.41% that you get with the earnings yield approach. Adding growth and excess returns to the equation is what brings it up to 4.44%, and I believe that the data is on my side, in this debate. To the critique that my approach requires estimates of earnings growth and excess returns that may be wrong, I agree, but I am willing to wager that whatever mistakes I make on either input will be smaller than the input mistakes made by assuming no growth and no excess returns, as is the case with the earnings yield approach.
Picking an Approach
I prefer the implied equity risk premium approach that I just described, as the best estimate of ERP, but that may just reflect my comfort with it, developed over time. Ultimately, the test of which approach is the best one for estimating equity risk premium is not theoretical, but pragmatic, since your estimate of the equity risk premium is used to obtain predictions of returns in subsequent periods. In the figure below, I highlight three estimates of equity risk premiums - the historical risk premium through the start of that year and the EP-based ERP (EP Ratio minus the T.Bond Rate) and the implied equity risk premiums, at the start of the year:
The historical risk premium is stable, but that stability is a reflection of a having a long tail of historical data that keeps it from changing, even after the worst of years. The implied and EP-based ERP approaches move in the same direction much of the time (as evidenced in the positive correlation between the two estimates), but the latter yields negative values for the equity risk premium in a large number of periods.
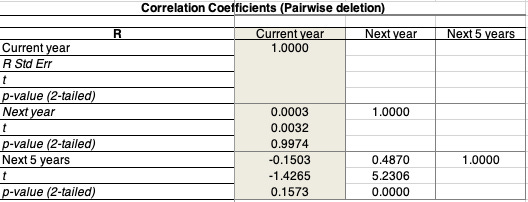
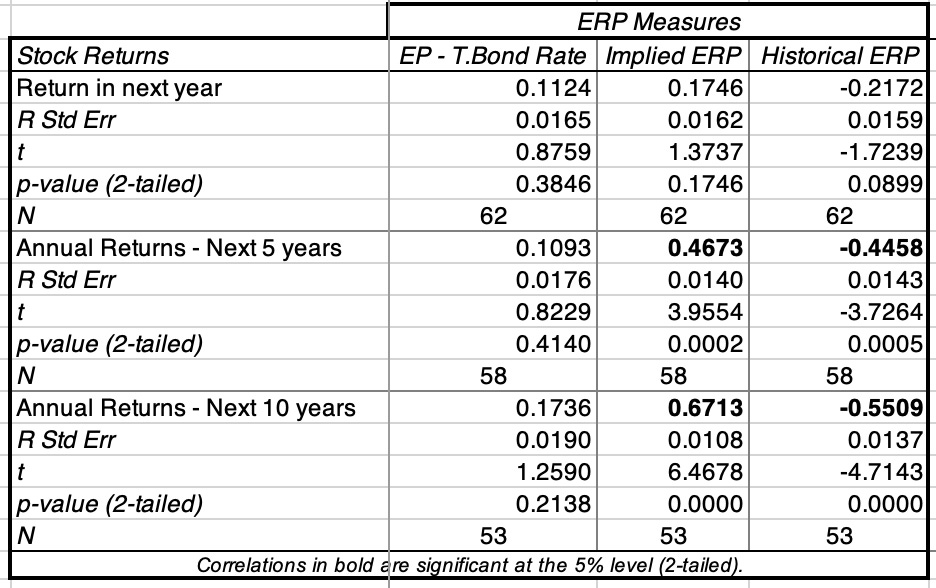
Ultimately, the test of whether an equity risk premium measure works lies in how well it predicts future returns on stocks, and in the table below, I try to capture that in a correlation matrix, where I look at the correlation of each ERP measure with returns in the next year, in the next 5 years and in the next 10 years:
None of the approaches yield correlations that are statistically significant, for stock returns in the next year, but the implied ERP and historical ERP are strongly correlated with returns over longer time periods, with a key difference; the former moves with stock returns in the next ten years, while the latter moves inversely.
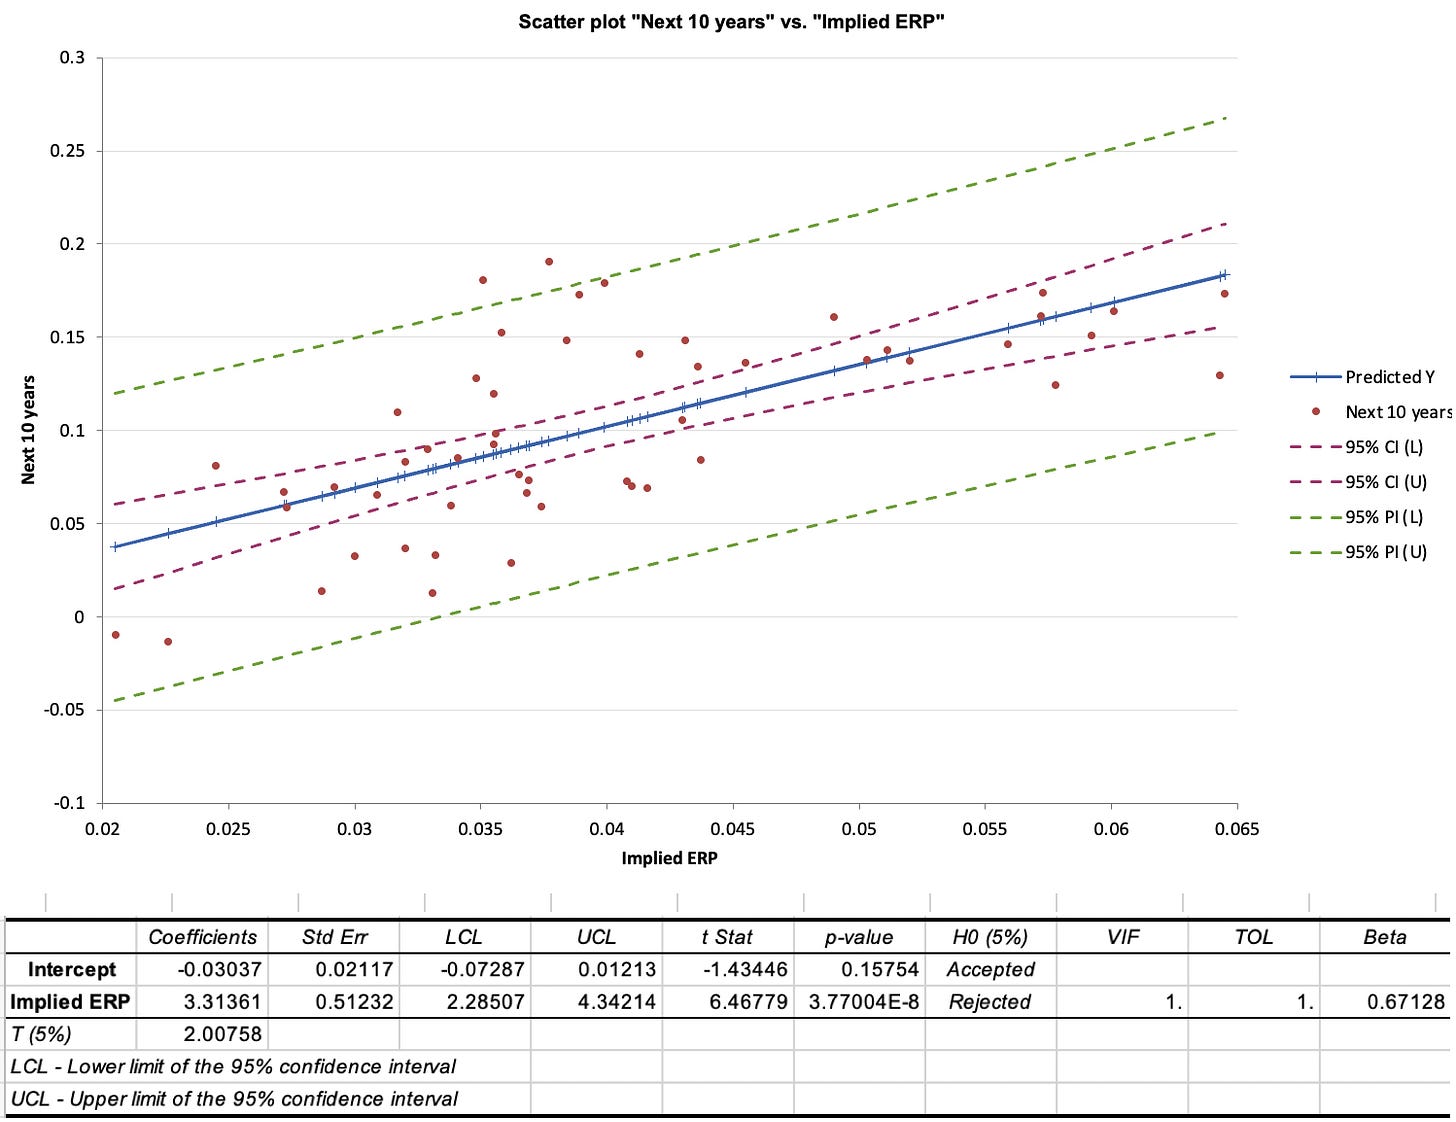
While that correlation lies at the heart of why I use implied ERP in my valuations as my estimate of the price of risk in equity markets, I am averse to using it as a basis for market timing, for the same reasons that I cautioned you on using the EP ratio regression: the predictions are noisy and there is no clear pathway to converting them into investment actions. To see why, I have summarized the results of a regression of stock returns over the next decade against the implied ERP at the start of the period, using data from 1960 to 2022:
You can see, from the scatter plot, that implied ERPs move with stock returns over the subsequent decades, but that movement is accompanied by significant noise, and that noise translates into a wide range around the predicted returns for stocks. If you are a market timer, you are probably disappointed, but this type of noise and prediction errors is what you should expect to see with almost any fundamental, including EP ratios.
Conclusion
I hope that this post has helped to convince you that the equity risk premium is central to investing, and that even if you have never used the term, your investing actions have been driven by its gyrations. I also hope that it has given you perspective on why you see the differences in equity risk premium numbers from different sources. With that said, here are some thoughts for the road that can help you in future encounters with the ERP:
There is a true, albeit unobservable, ERP: The fact that the the true equity risk premium is unobservable does not mean that it does not exist. In other words, the notion that you can get away using any equity risk premium you want, as long as you have a justification and are consistent, is absurd. So, whatever qualms you may have about the estimation approaches that I have described in this post, please keep working on your own variant to get a better estimate of the ERP, since giving up is no an option.
Not all estimation approaches are created equal: While there are many approaches to estimating the equity risk premium, and they yield very different numbers, some of these approaches have more heft, because they offer better predictive power. Picking an approach, such as the historical risk premium, because its stability over time gives you a sense of control, or because everyone else uses it, makes little sense to me.
Your end game matters: As I noted at the start of this post, the equity risk premium can be used in a multitude of investment settings, and you have to decide, for yourself, how you will use the ERP, and then pick an approach that works for you. I am not a market timer and estimate an equity risk premium primarily because I need it as an input in valuation and corporate finance. That requires an approach that yields positive values (ruling out the EP-based ERP) and moves with with stock returns in subsequent periods (eliminating historical ERP).
Market timers face a more acid test: If you are using equity risk premiums or even earnings yield for market timing, recognize that having a high R-squared or correlation in past returns will not easily translate into market-timing profits, for two reasons. First, the past is not always prologue, and market and economic structures can shift, undercutting a key basis for using historical data to make predictions. Second, even if the correlations and regressions hold, you may still find it hard to profit from them, since you (and your clients, if you are a portfolio manager) may be bankrupt, before your predictions play out. Statistical noise (the standard errors on your regression predictions) can create havoc in your portfolios, even if it eventually gets averaged out.
YouTube Video
Data Links
Historical returns on Stocks, Bonds and Real Estate: 1928 - 2022
Earnings to Price Ratios and Dividend Yields, by Quarter: 1988 Q4- 2023 Q2
Spreadsheet
Papers





Extraordinary work; enlightening and useful. Thanks
Thanks for your high quality work.
Regarding your point about models needing to evolve to properly meet current factors...
I’d love your take on how the huge amount of Passive Fund flows might interact with this.
Meaning, do the enormous flows into index funds diminished in any way the usefulness of these models when those passive funds are ignoring all valuation, models, and just buying regardless?
And,
I’m seeing some interesting analysis being done on the powerful effect the broadest measures of global liquidity having more effect on expanding PE ratios than were previously thought.
Anyway, appreciate your work. Thanks.